As FinOps engineers, our responsibilities extend beyond simply identifying resources and their associated costs. We must develop a comprehensive understanding of our environment's behavior by augmenting our infrastructure data with utilization metrics. This is why we have implemented a standardized procedure to query metrics in Google Monitoring.
To achieve complete visibility into workloads and infrastructure—whether analyzing CPU utilization of virtual machines or measuring the total capacity of Google Storage buckets—we require the capability to extract metrics data points and incorporate them into our automation workflows.
Given the comprehensive nature of the GCP Monitoring service, we would like to share some fundamental principles to help initiate your exploration of metrics and utilization analysis.
Example Workflow
This example demonstrates how to create a comprehensive report on Google Storage buckets.
The workflow combines two key phases:
- Discovery Phase: We list all buckets in our environment
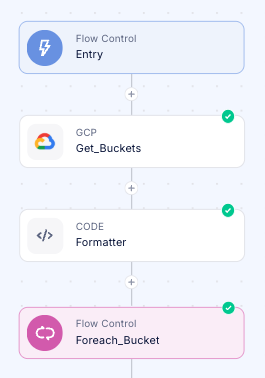
- Metrics Analysis:
 We utilize the Query GCP Monitoring metrics step to access the following critical metrics:
storage.googleapis.com/storage/total_bytesstorage.googleapis.com/storage/object_count
This integrated approach allows us to gather complete information about both the existence of storage resources and their actual utilization metrics for more informed FinOps decision-making.
Configure The Monitoring Step

To effectively construct the appropriate filters, we must first develop a deeper understanding of the monitoring capabilities provided by the Google Cloud Platform Monitoring library.
This document provides a comprehensive overview of accessing and analyzing time-series metric data in Google Cloud Monitoring through the timeSeries.list method. It explains how users can retrieve specific metrics by applying filters to select particular resources or metric types, define time intervals for data collection, and perform statistical aggregations to derive meaningful insights. The guide demonstrates practical examples including listing available time series, retrieving raw data points for specific resources, aligning measurements into consistent time periods, and reducing multiple time series into aggregated views. Rather than being merely a technical reference, the document serves as a pathway for FinOps engineers and cloud administrators to transform raw monitoring data into actionable intelligence about resource utilization and performance patterns, enabling more informed decision-making about cloud resource management.
Part of this document is the #time-series_filters - which brings us to the definition of the method:
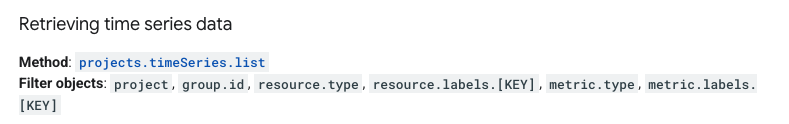
By default, we're handling the Metric Type in the step, but now you can add your own filters!
In our example, we will need to specify the resource.label, but how can we tell which key do we need? Let's check the documentation again.
- We need to find the relevant metric we want to query (https://cloud.google.com/monitoring/api/metrics_gcp.
For our use-case, it'll be object_count:
- We can see that the resource is gcs_bucket, we can now search for it in the GCP resources page to find the relevant resources labels:

And now we have all the information we need!
Let's construct the filter properly with the bucket_name label:
resource.label.bucket_name="{{Foreach_Bucket.output.metadata.name}}"We can also add additional filters with AND:
resource.label.bucket_name="{{Foreach_Bucket.output.metadata.name}}" AND resource.label.location="{{Foreach_Bucket.output.metadata.location}}"Summary
In this documentation we have demonstrated how the GCP monitoring step can enhance our discovery data with additional monitoring information. This represents a crucial capability for FinOps engineers to ensure that optimization data is comprehensive, enabling us to understand not just the resources provisioned in the cloud, but also their utilization patterns and behavior over time. This holistic view allows organizations to make meaningful FinOps decisions that positively impact the bottom line while preserving performance standards, SLAs, and other critical criteria.
Was this article helpful?
That’s Great!
Thank you for your feedback
Sorry! We couldn't be helpful
Thank you for your feedback
Feedback sent
We appreciate your effort and will try to fix the article